
GainsGurus: Visualizing Financial Data for Investor Empowerment
- The Brief
- Design digital platform and brand identity for a data-driven investment strategy company
- My Role
- UX/UI Design, Branding (Logo Design, Visual Identity Foundations)
Overview:
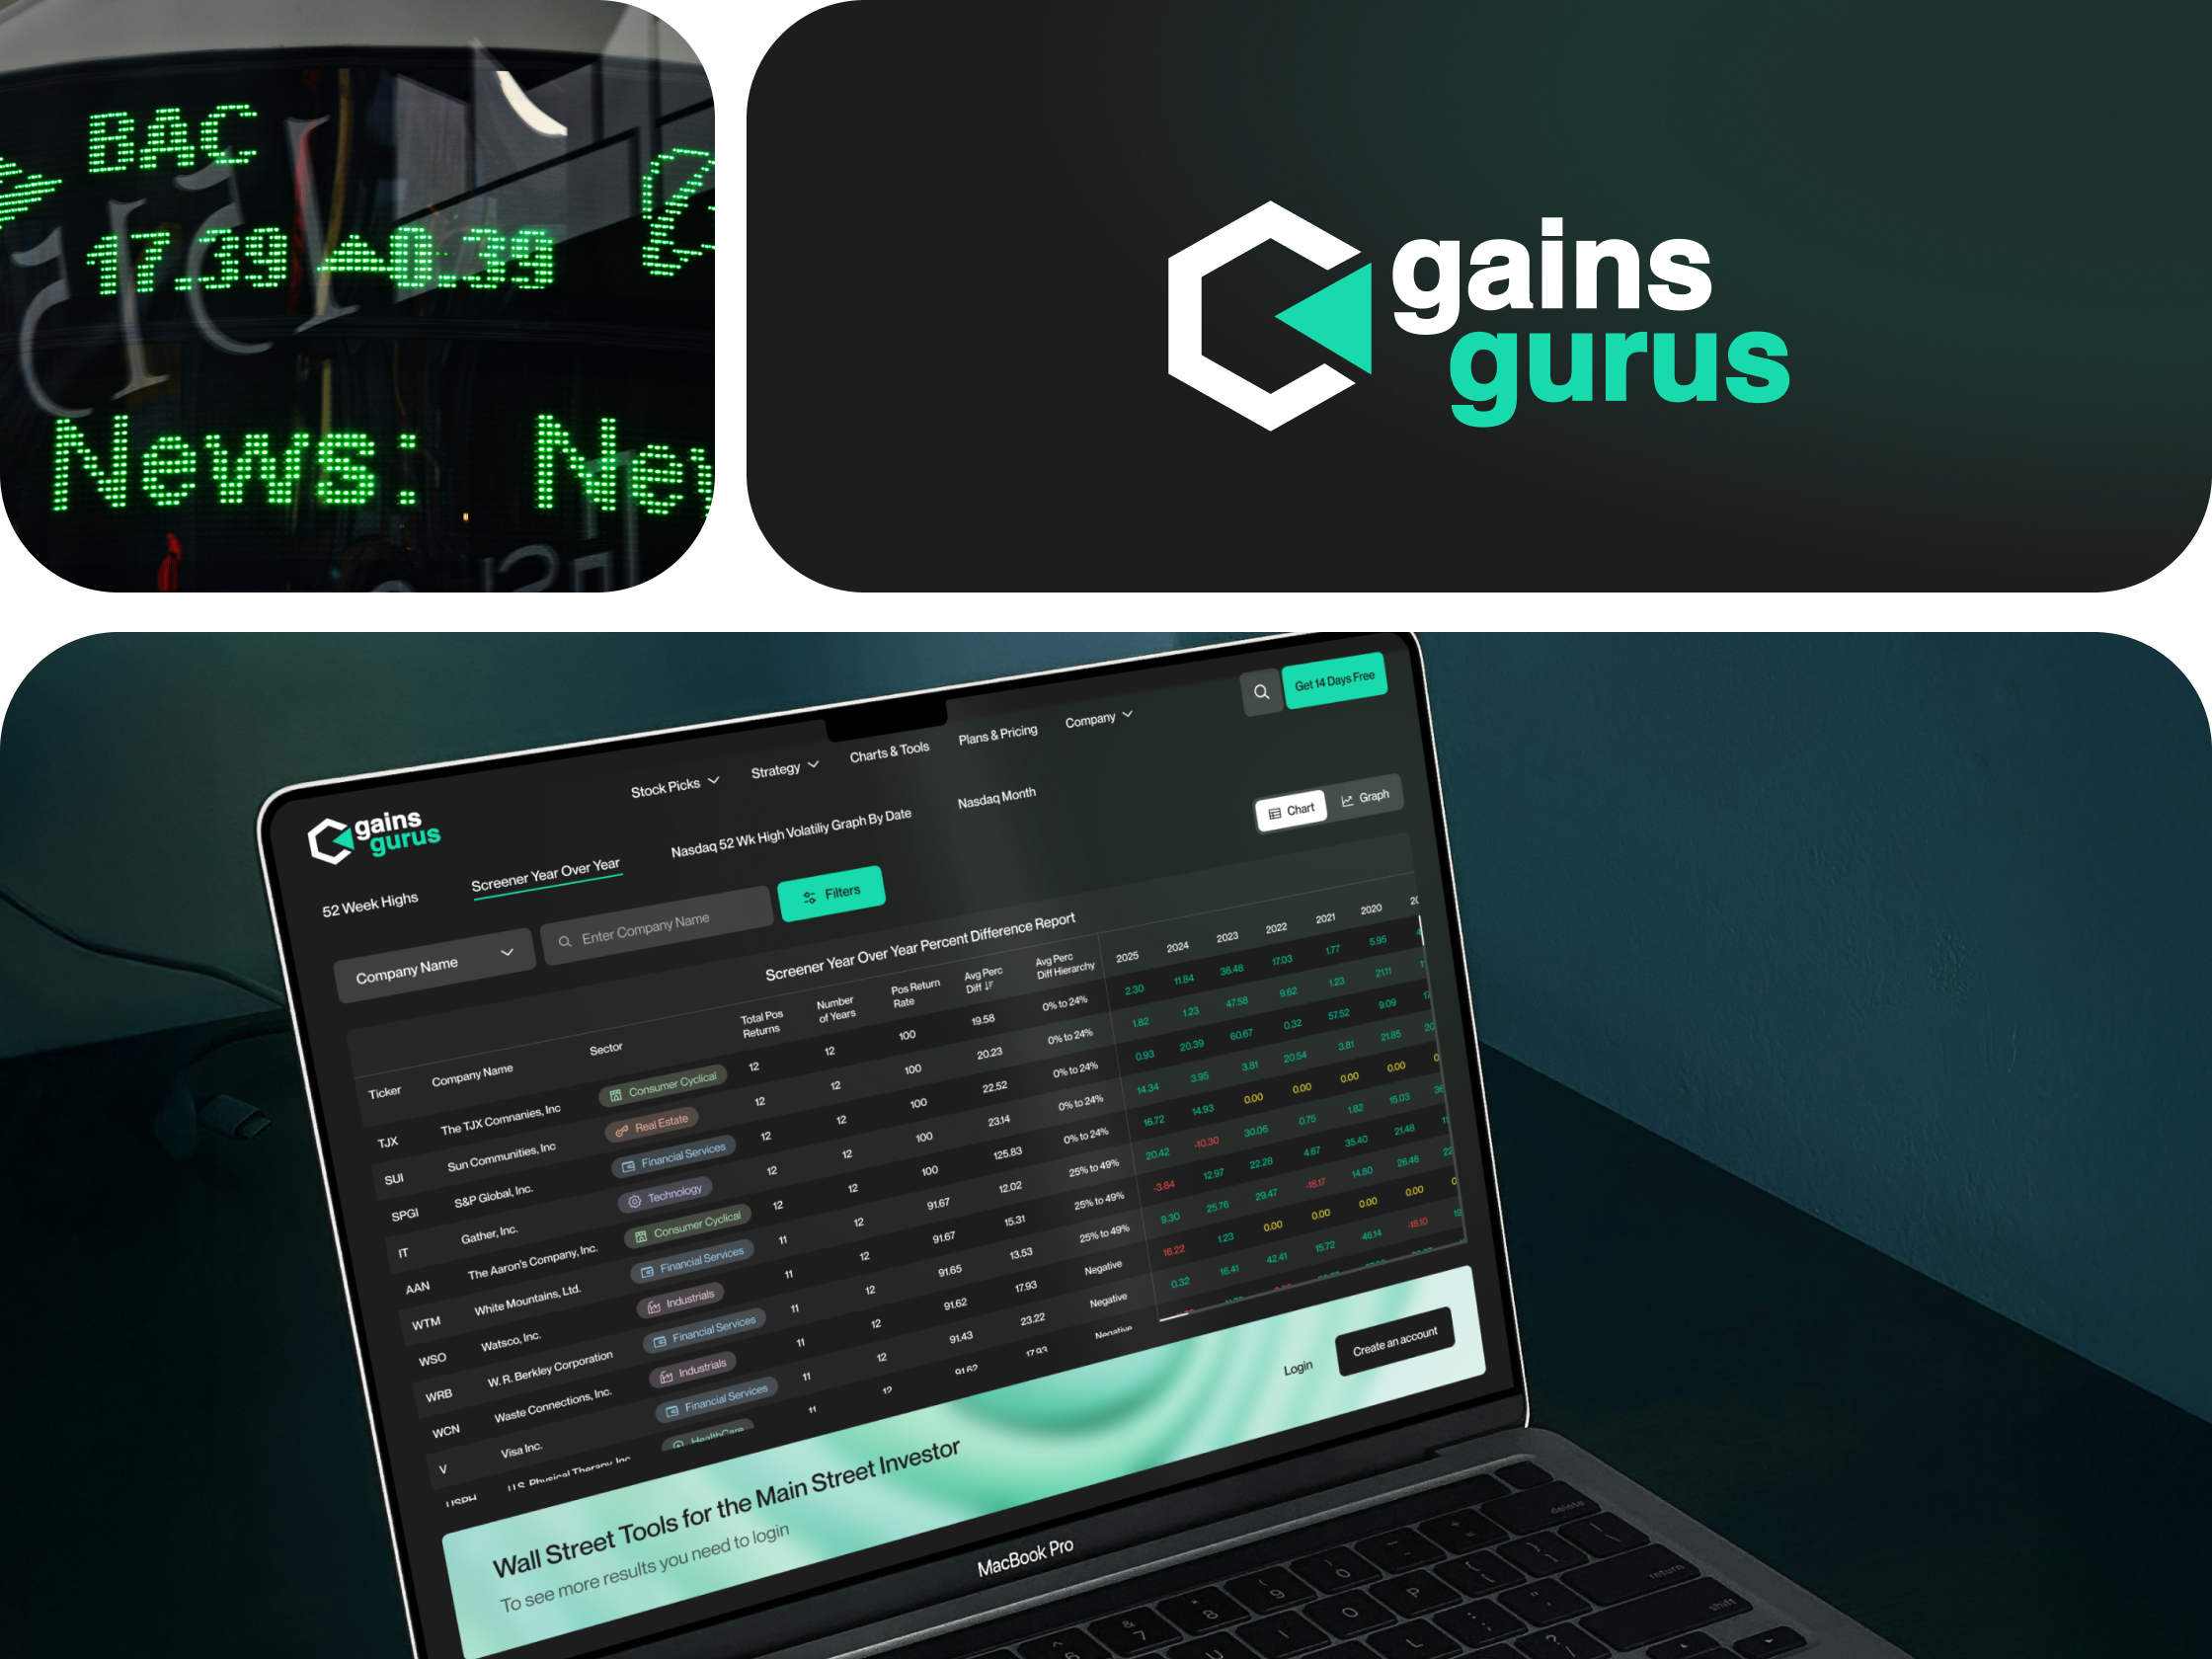
GainsGurus is a financial advisory company that equips investors with data to create successful long-term strategies. As the UX/UI designer, I was tasked with developing a digital platform to present complex financial data in an accessible and interactive manner.
Problem:
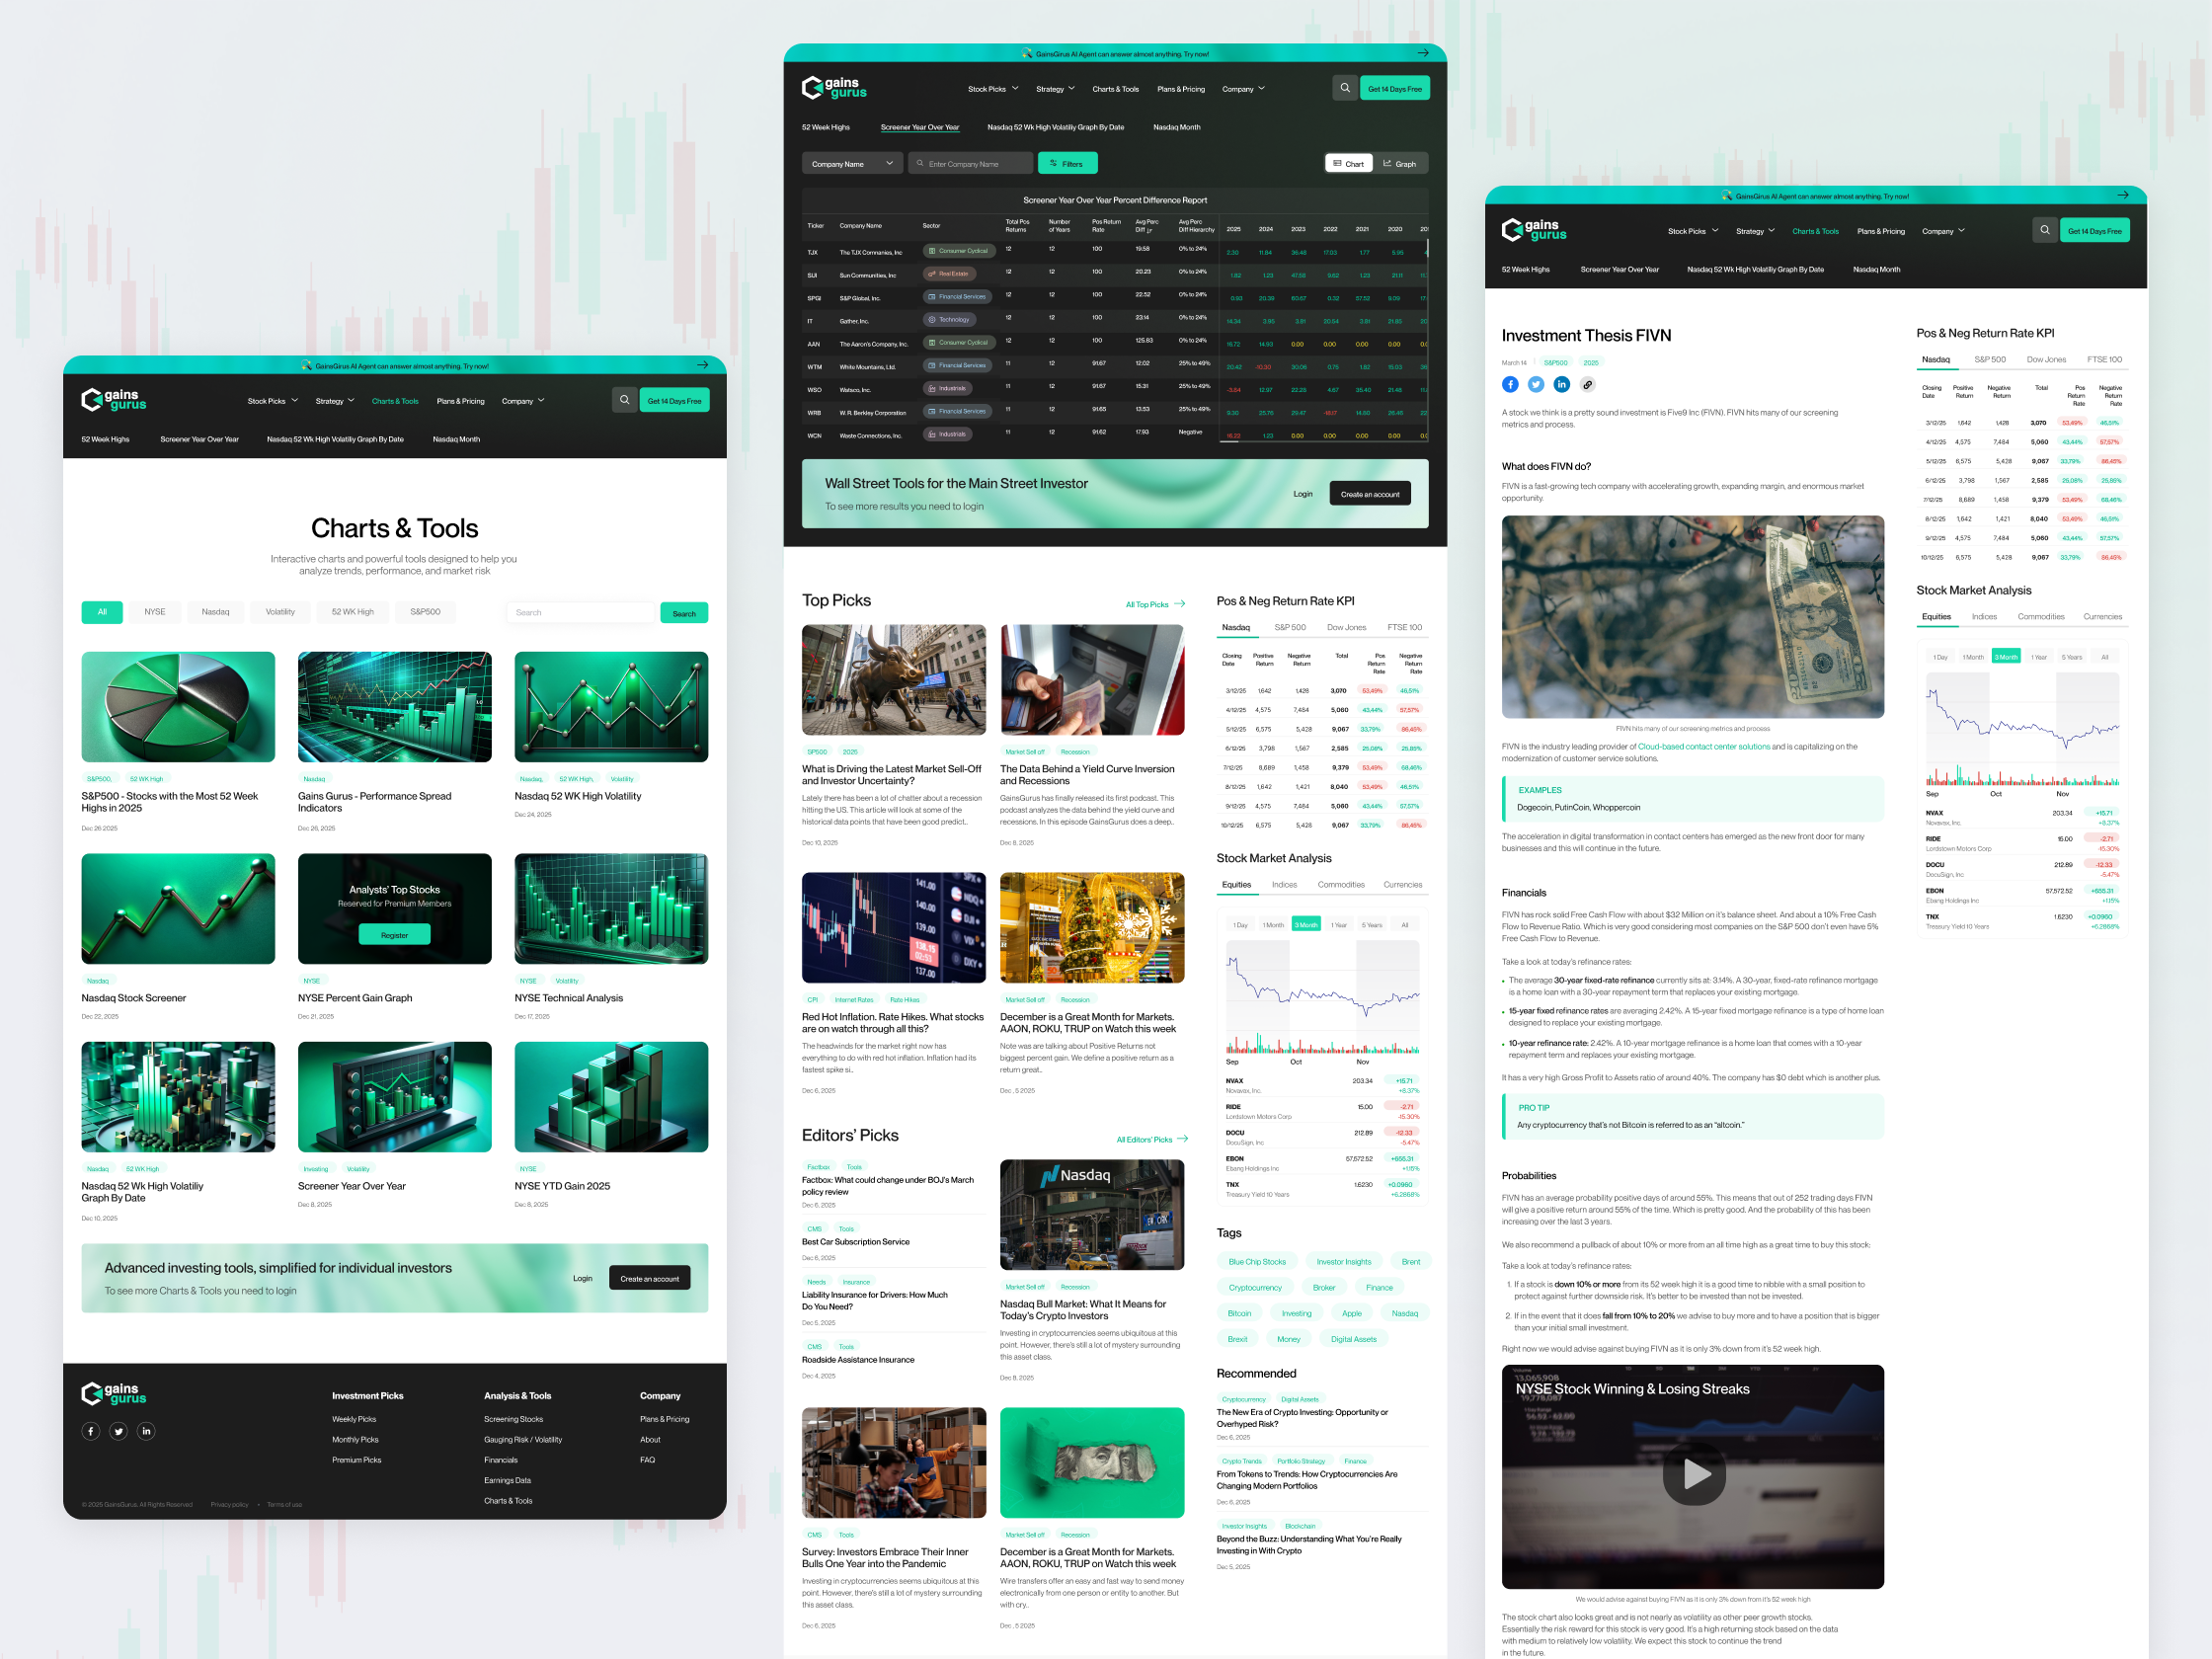
The client needed a platform to showcase their proprietary algorithms for extracting and processing financial data. The challenge was to present complex analytical information, including 52-week highs, volatility, and performance spread indicators, in a user-friendly interface suitable for investors with varying levels of expertise.
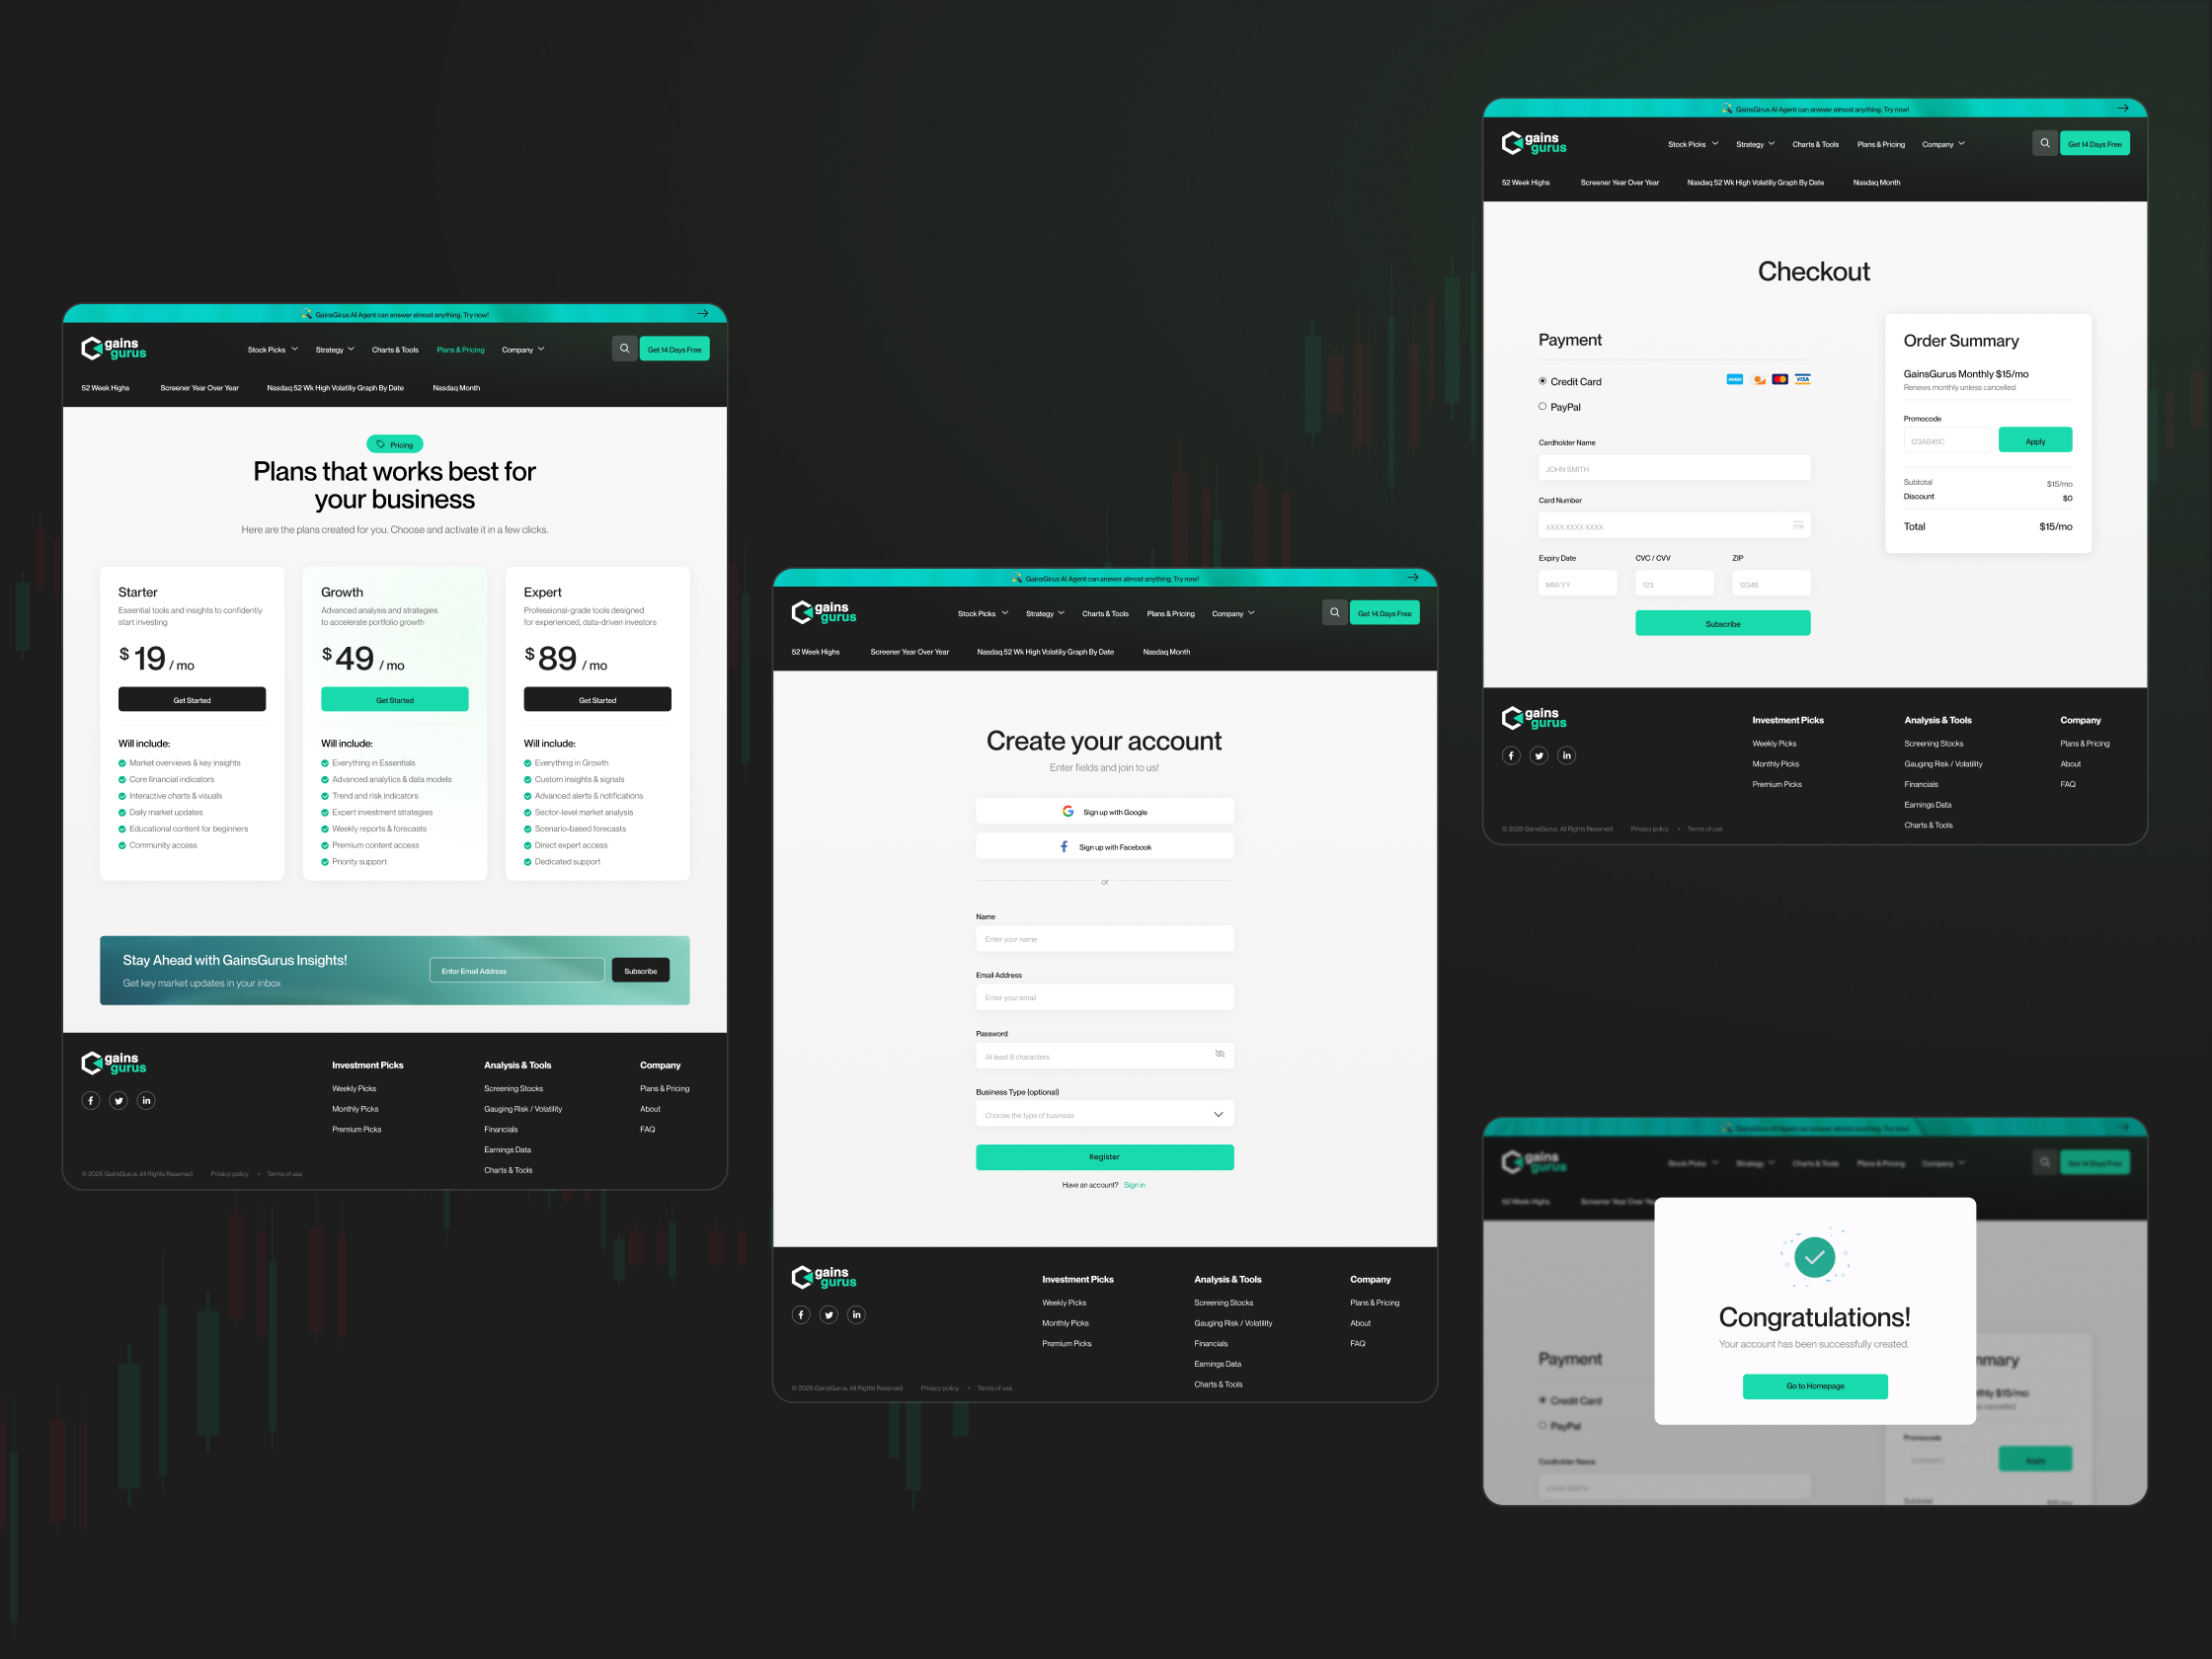
Solution:
I designed an intuitive digital platform with interactive tools for analyzing key financial indicators. The solution included custom data visualizations and premium content available on a subscription basis, allowing users to explore data and build personal models and forecasts.


Design Process:
-
Research and Planning:
I began by defining the platform's goals and understanding the target audience. I conducted extensive competitor analysis, studying the structure and features of similar financial platforms. This research helped me identify opportunities for improvement and unique features that would set GainsGurus apart.
-
Prototyping:
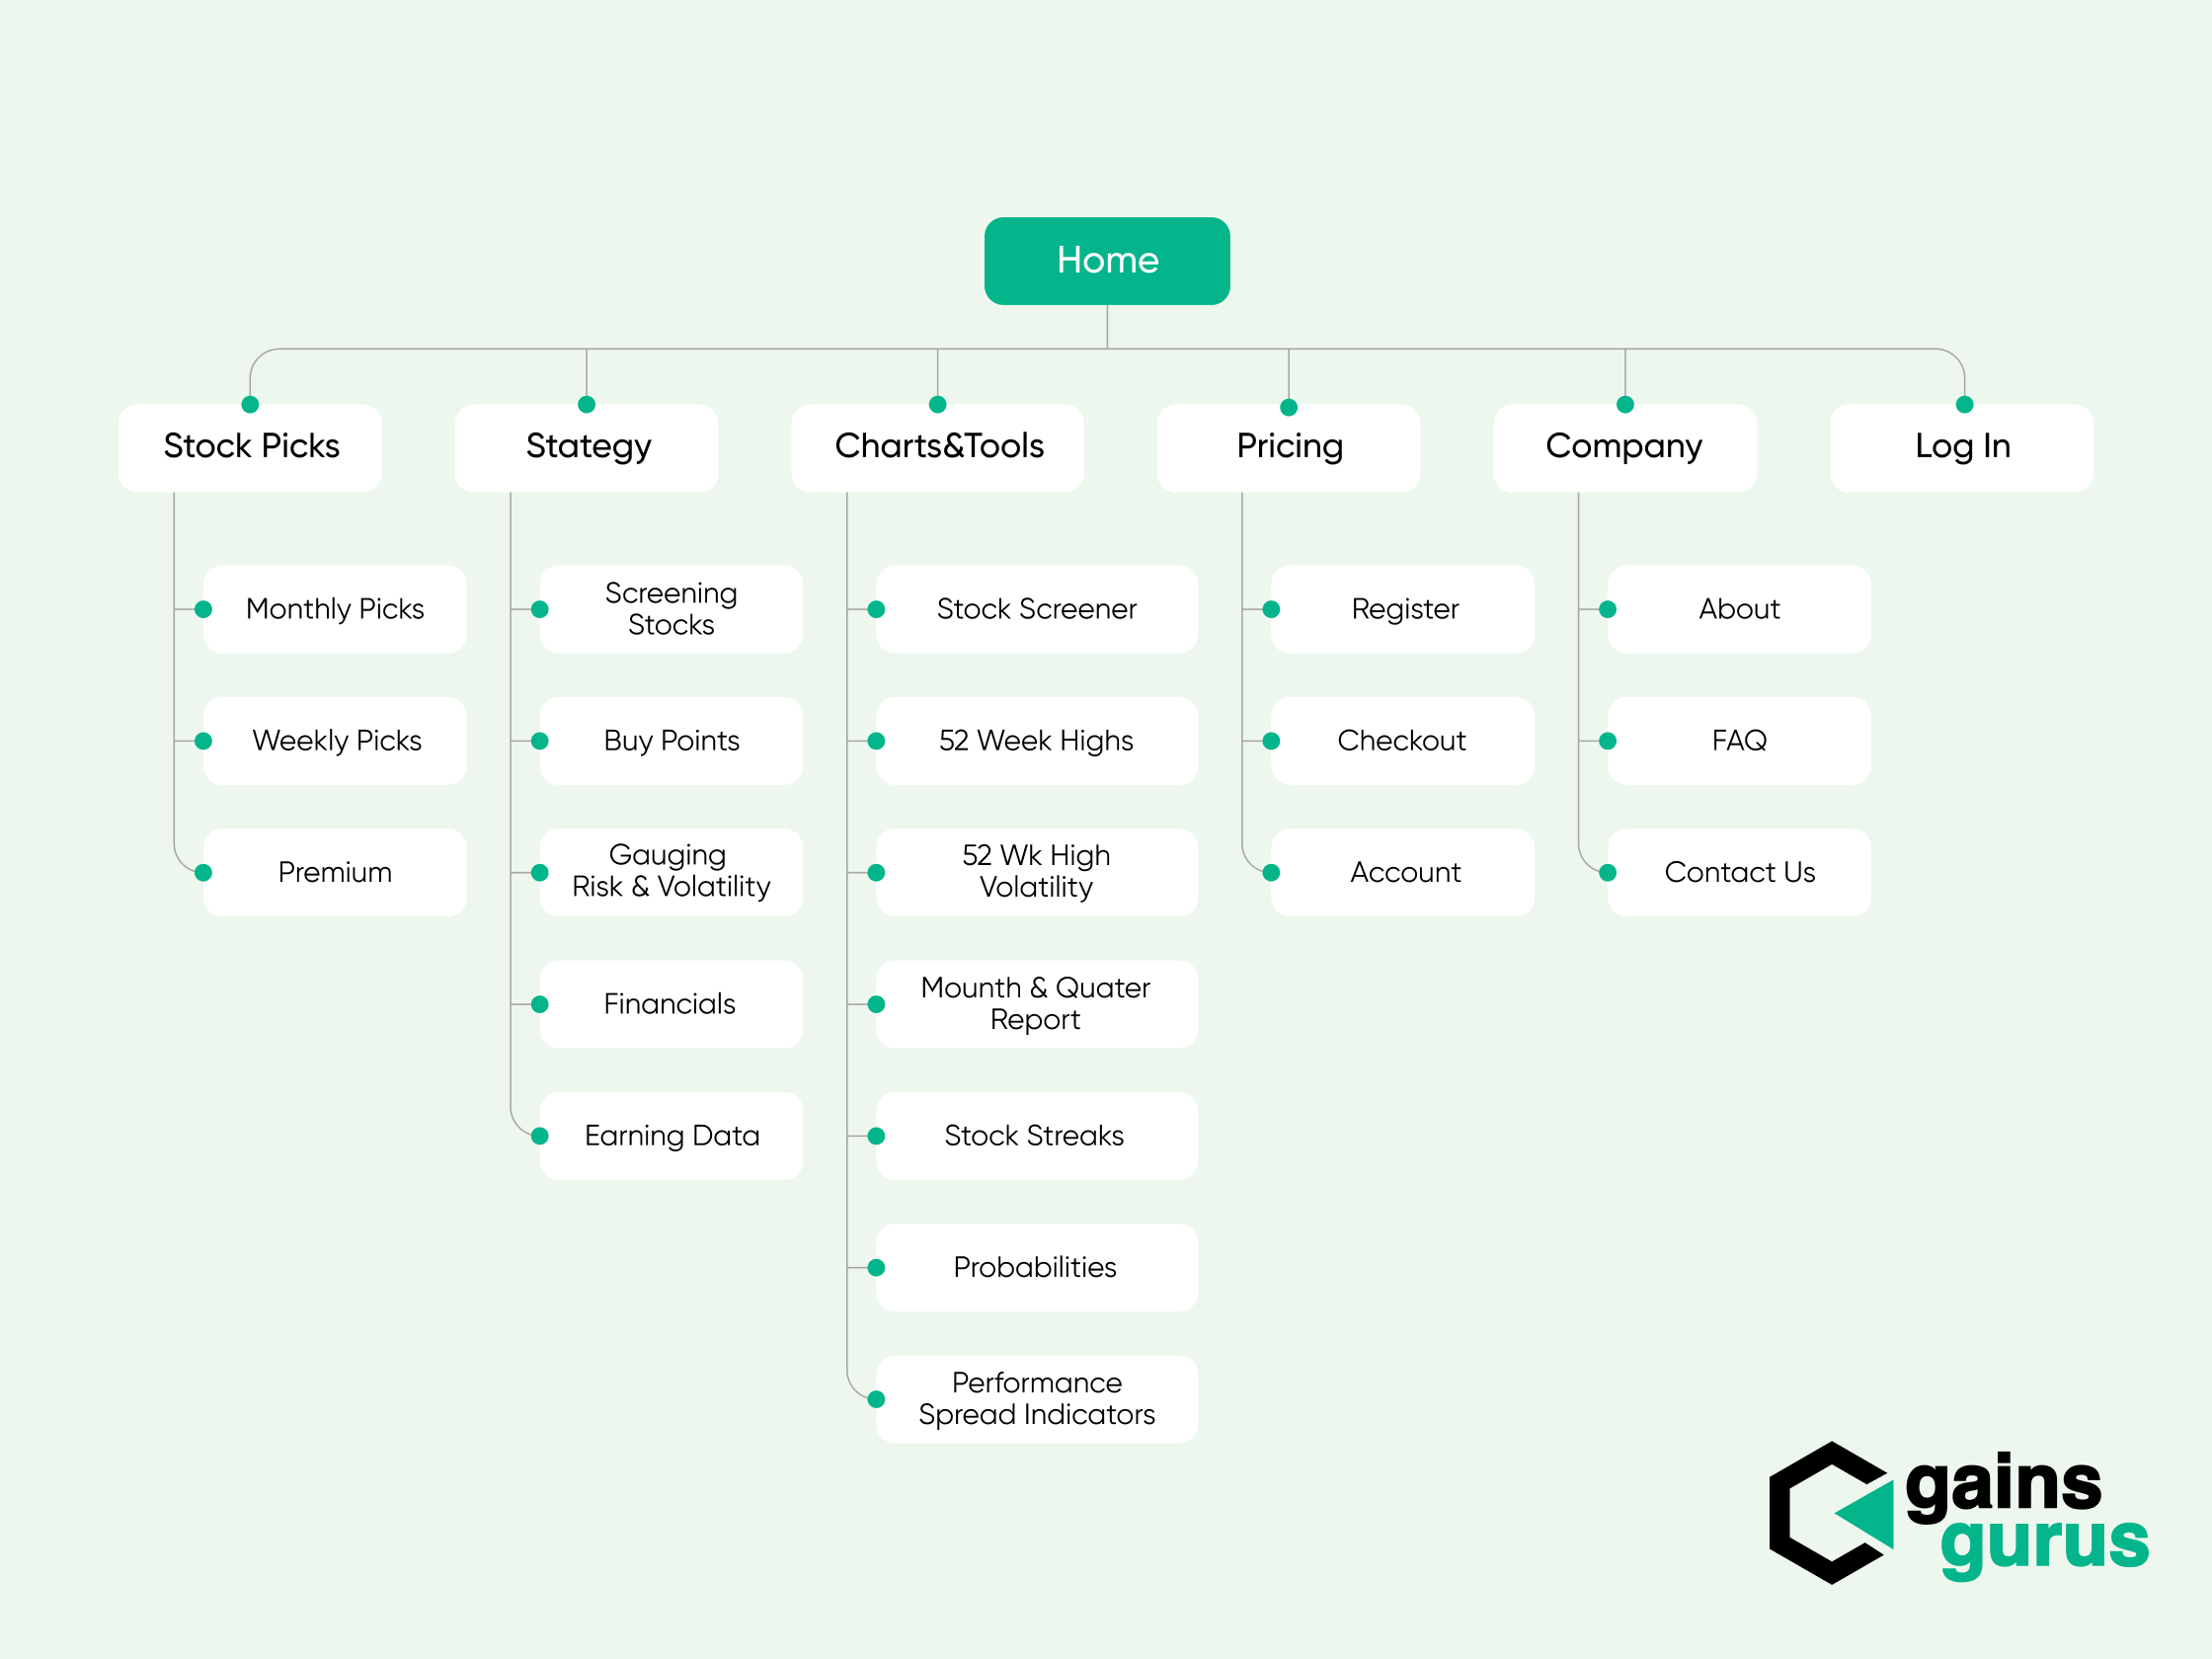
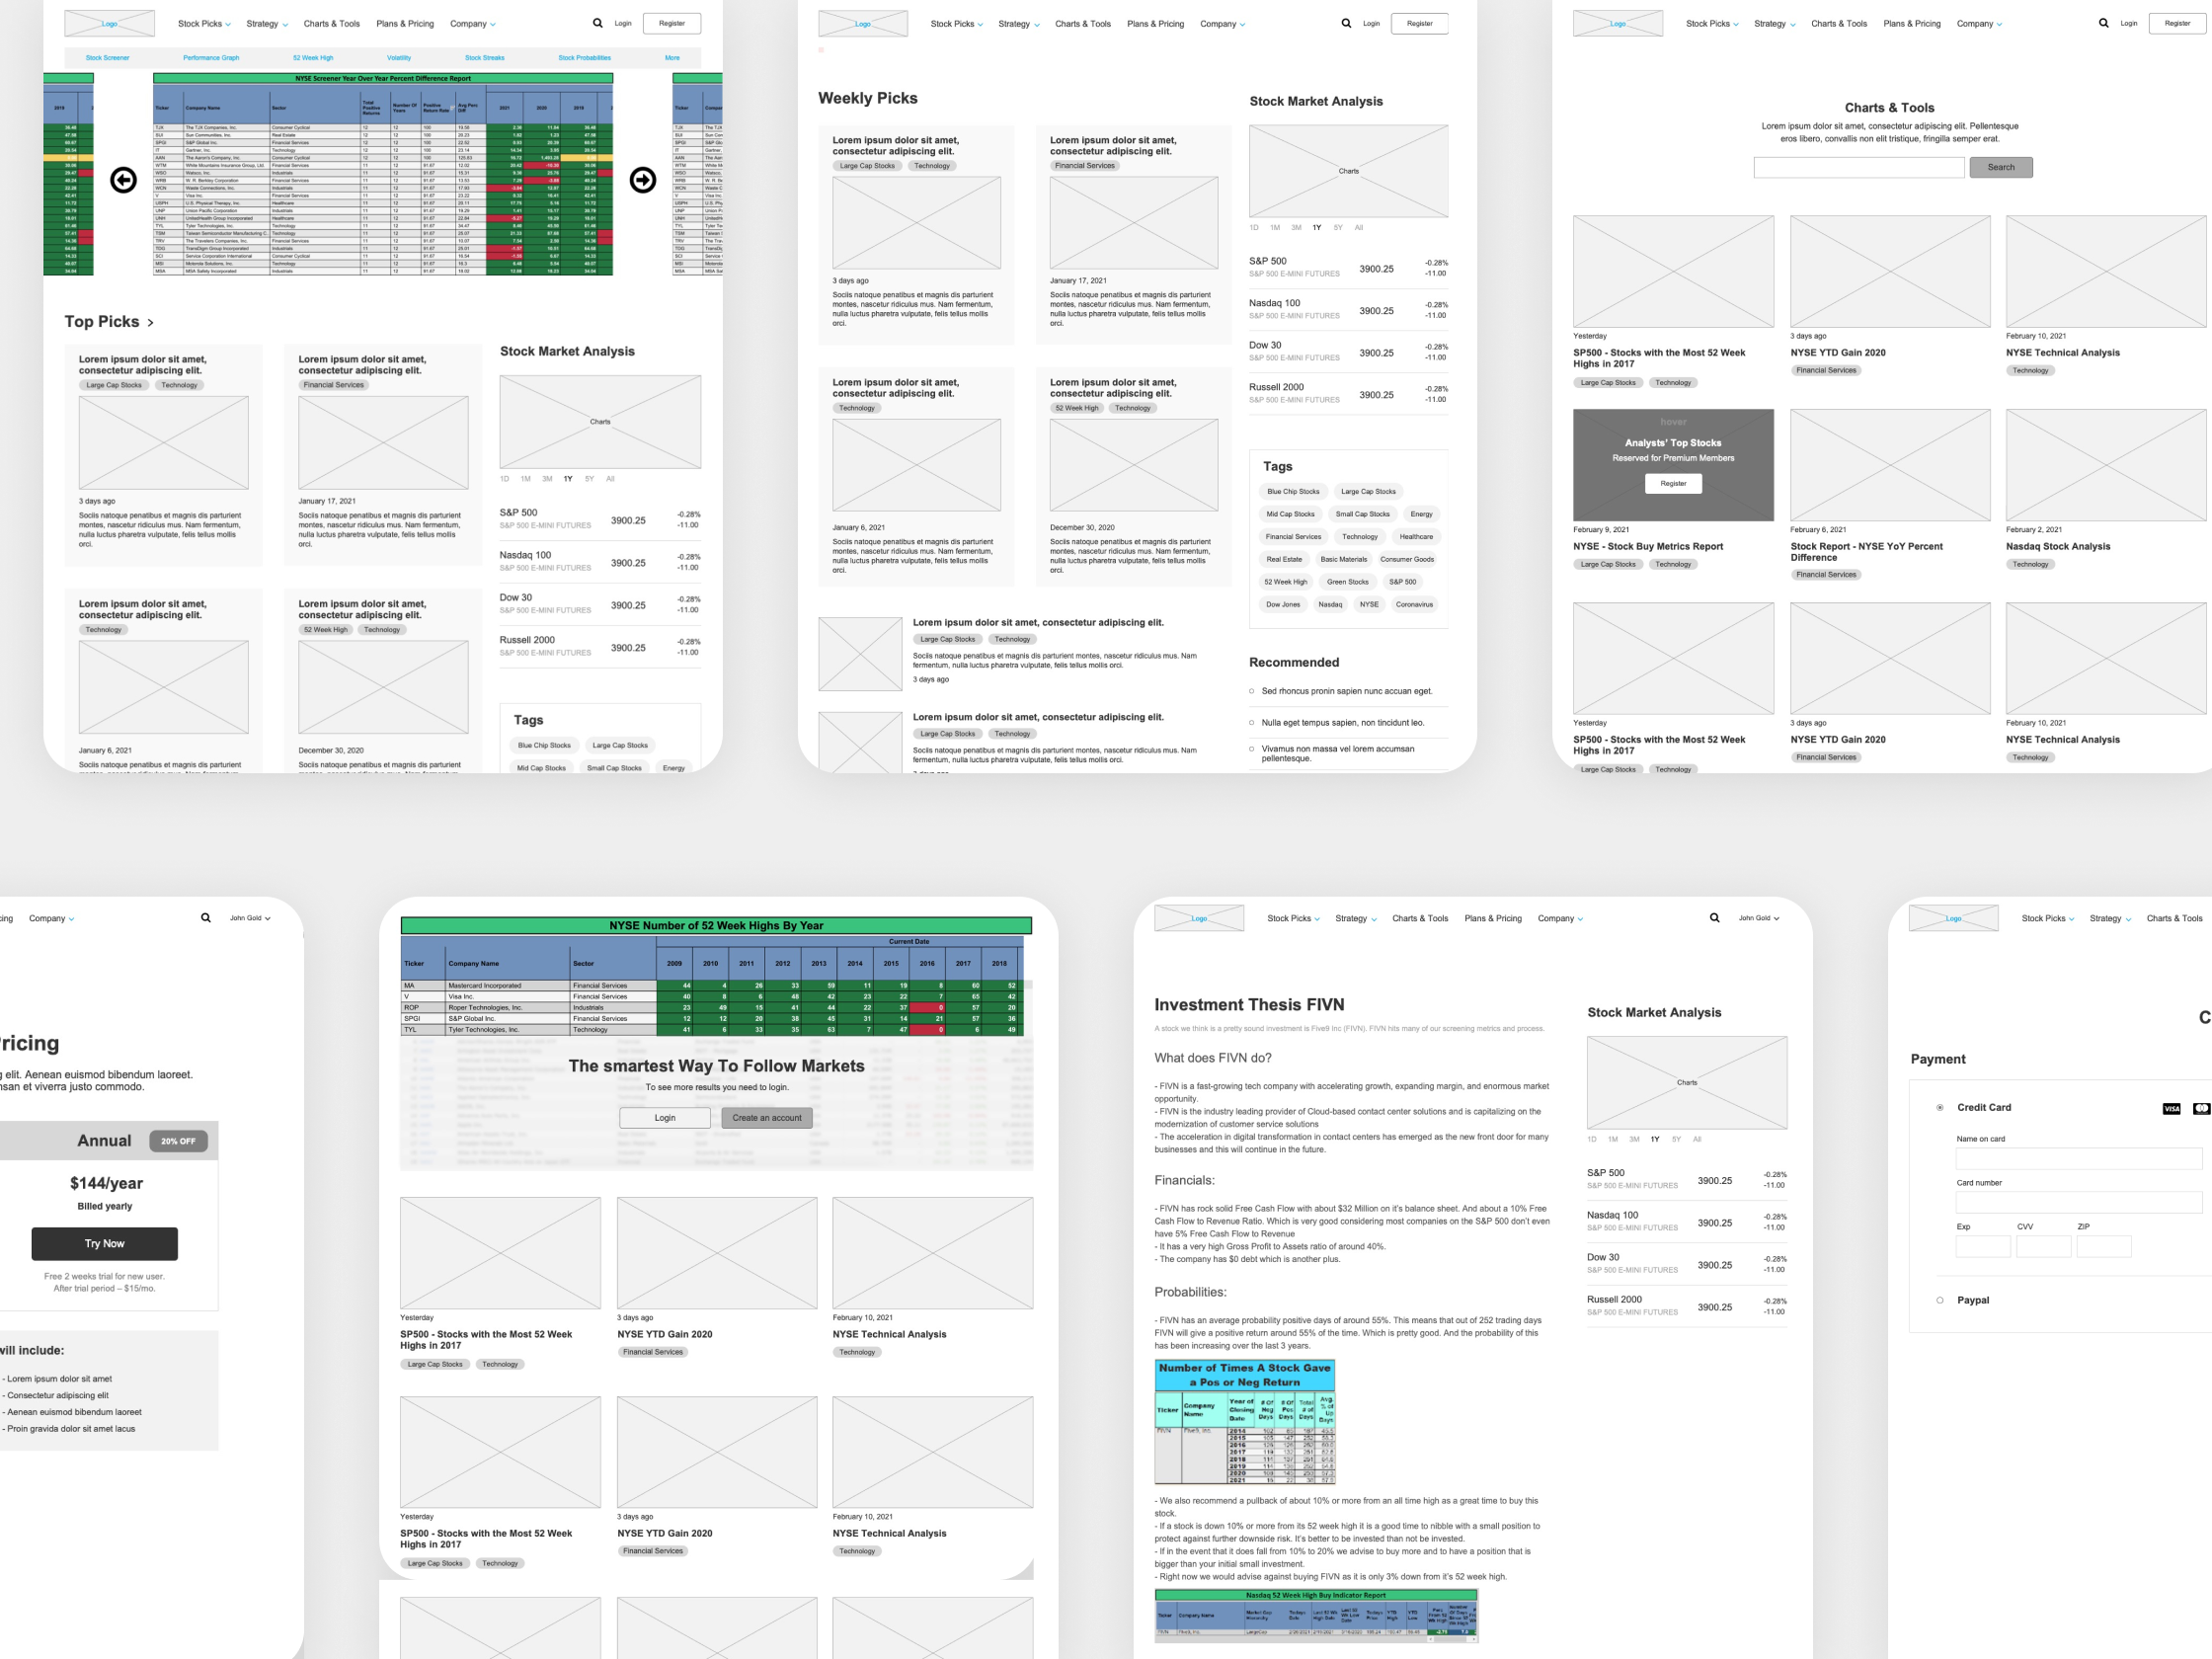
Using insights from the research phase, I created a comprehensive site map to establish the platform's structure and navigation hierarchy. I then developed low-fidelity wireframes for key pages, focusing on user journeys and interaction points. This stage was crucial in laying out the foundation for complex data presentation.
-
UI Design:
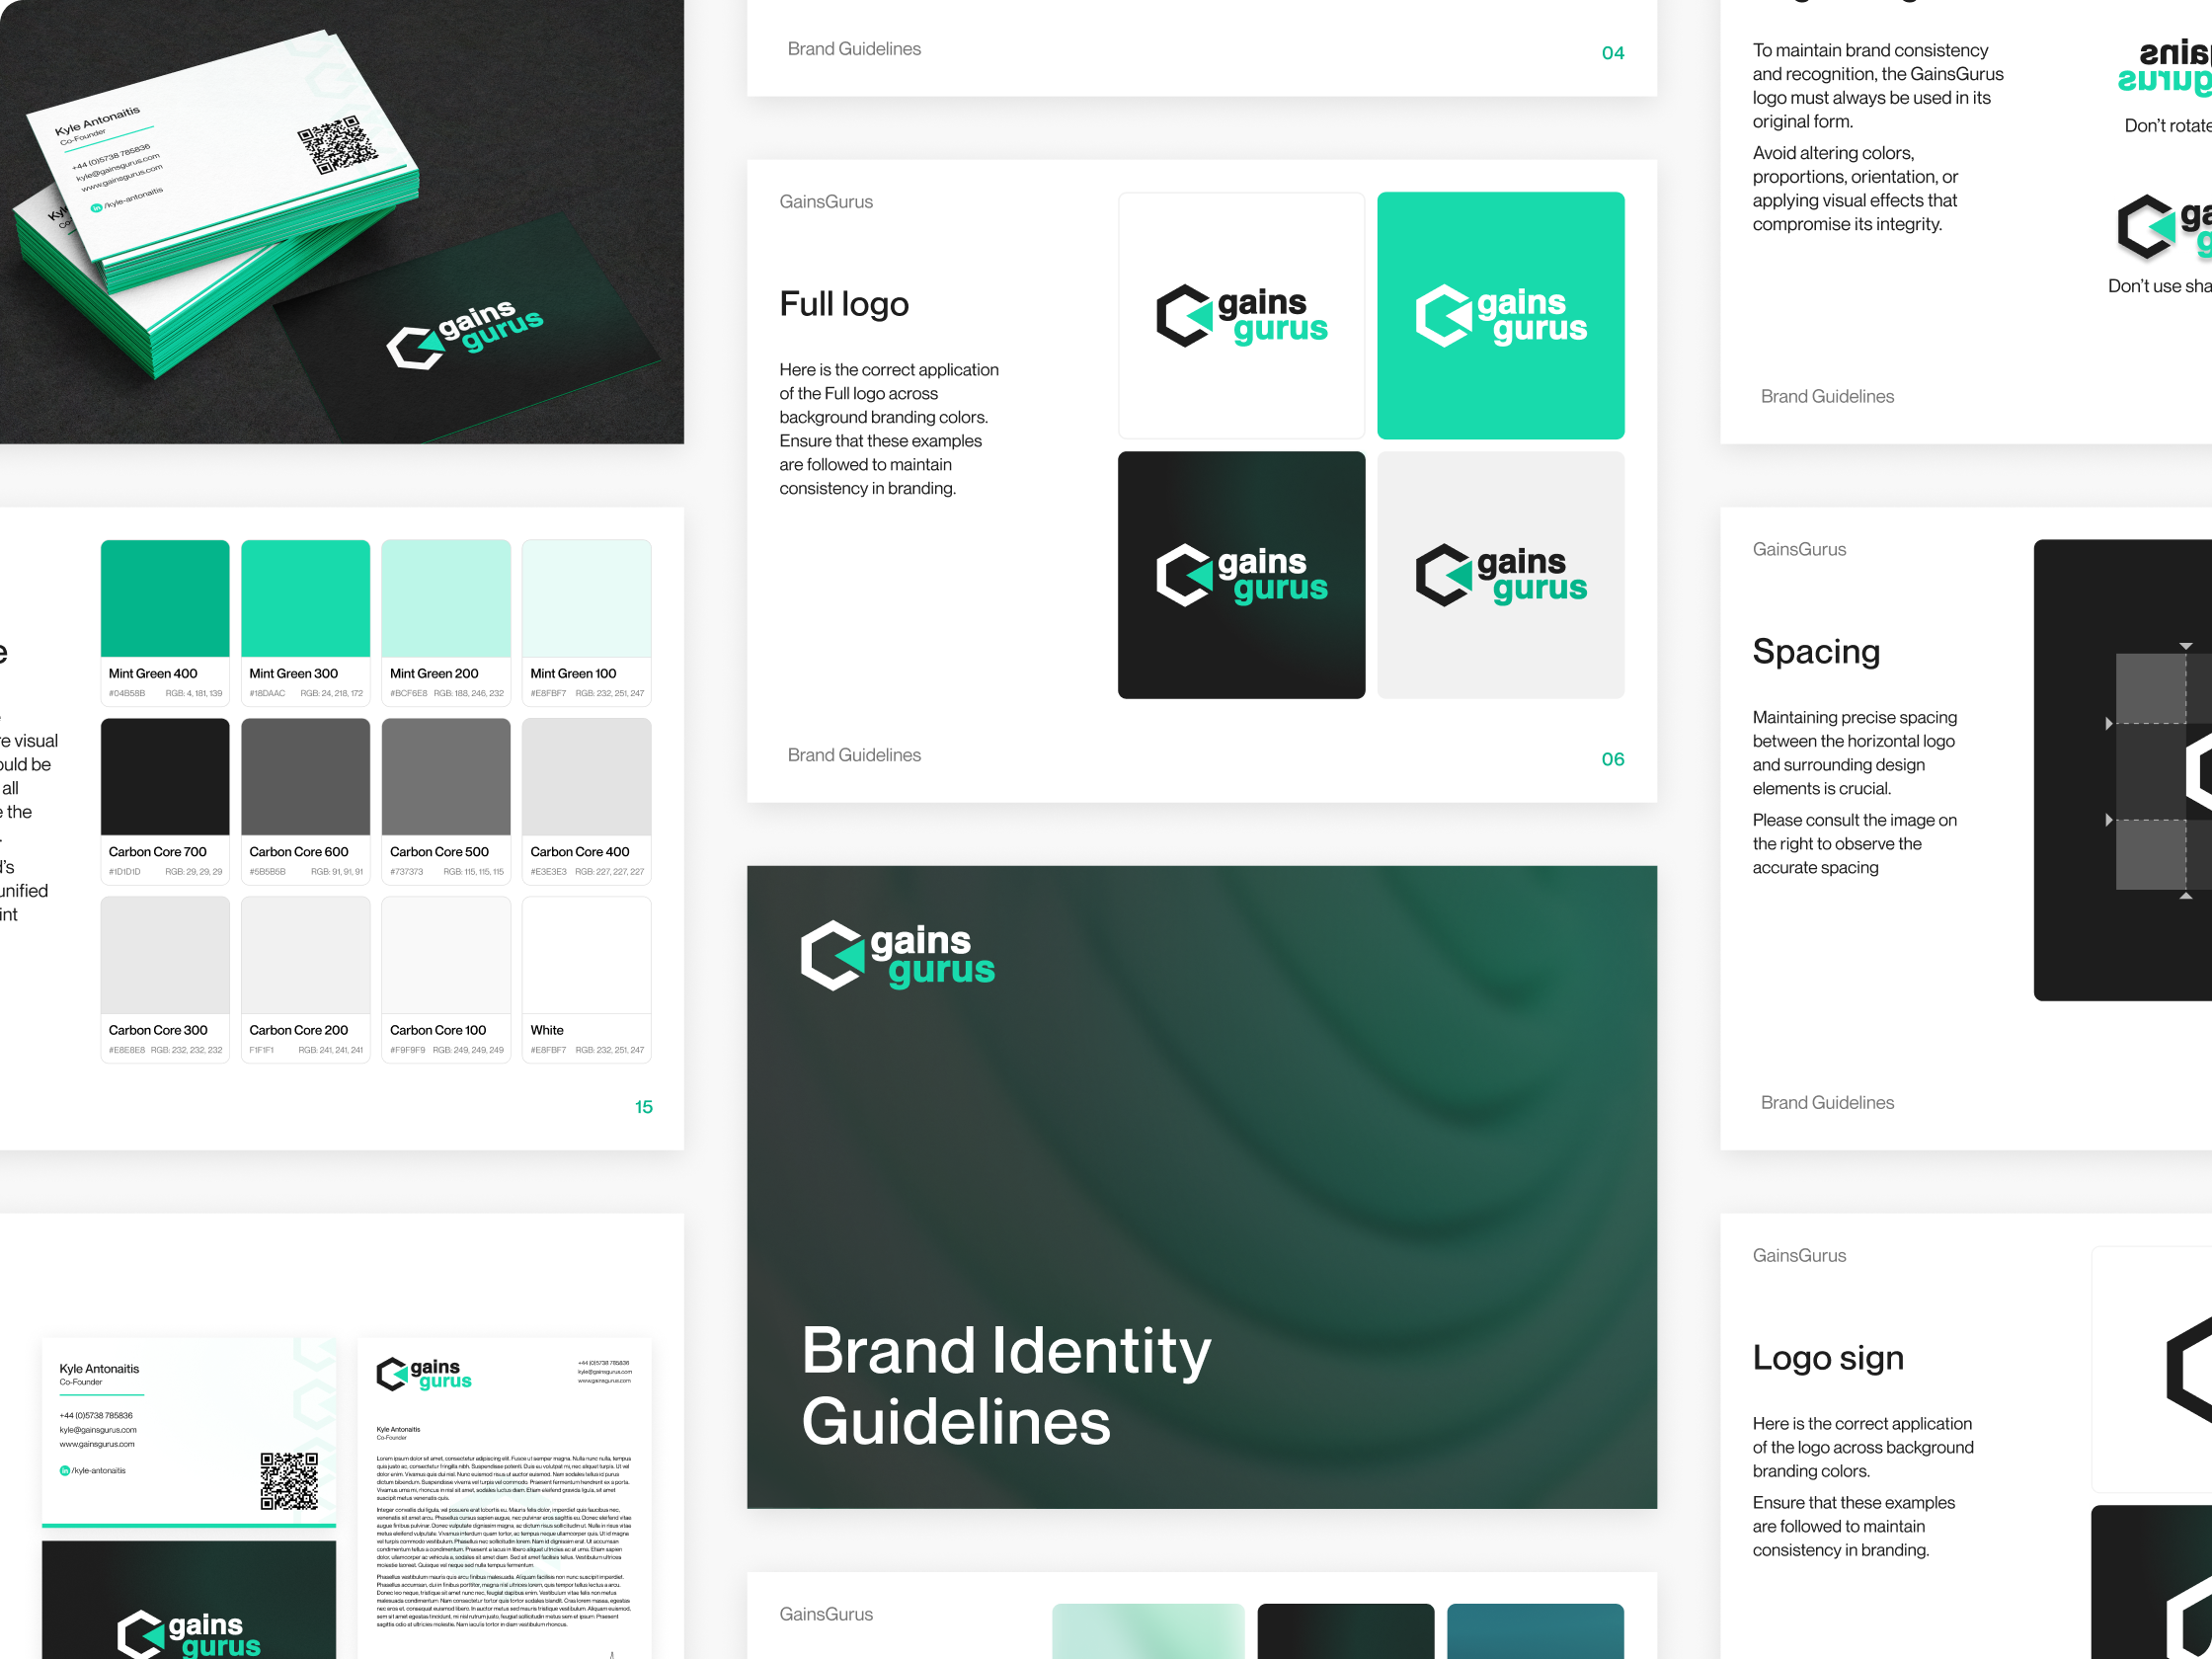
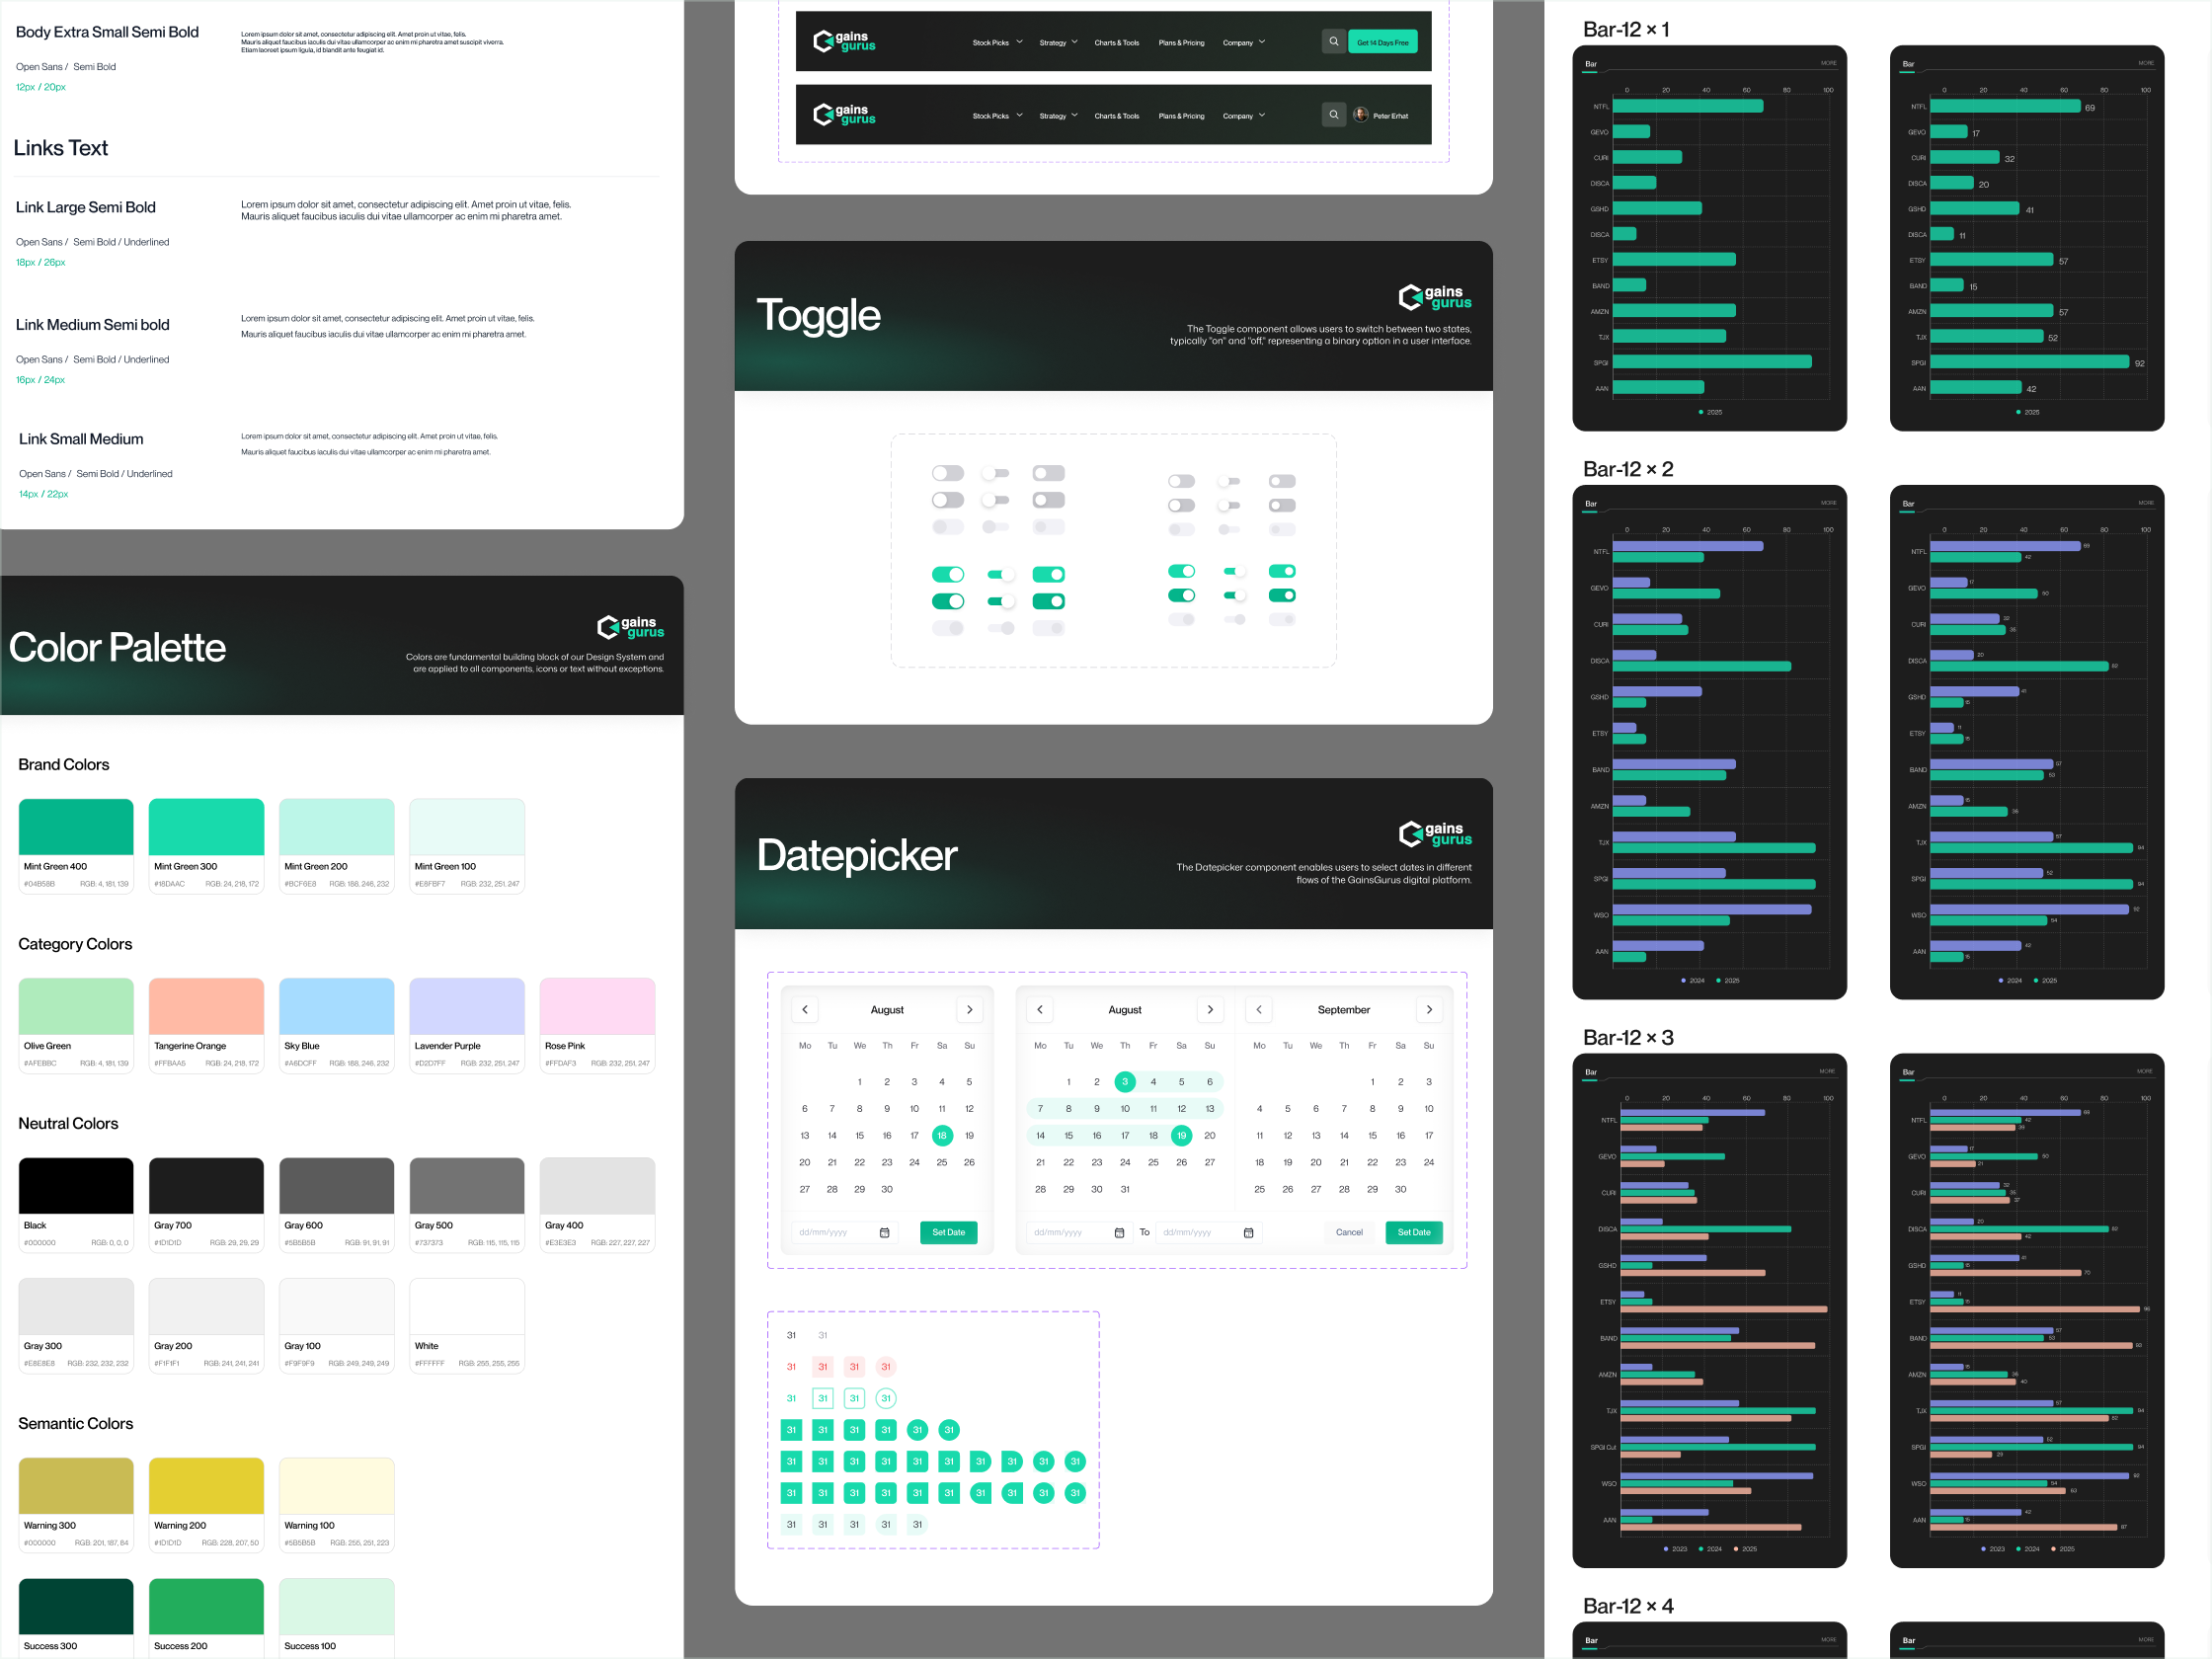
I translated the wireframes into high-fidelity prototypes, carefully selecting a color scheme, typography, and visual elements that aligned with financial data presentation best practices. I paid special attention to data visualization techniques, creating custom charts, graphs, and tables to present information clearly and efficiently.
-
Design System and Developer Handoff:
I created a robust design system to ensure consistency across the platform. This included detailed specifications for interactive elements like buttons, sliders, and data filters. I prepared interactive prototypes and animation references to guide the development team in implementing the design accurately.
-
Collaboration and Refinement:
Throughout the development phase, I worked closely with the technical team, providing guidance on implementing the UX/UI design. I participated in regular testing sessions, helping to identify and resolve usability issues. This collaborative approach ensured that the final product met both design and technical requirements.
Challenges:
- Visualizing complex financial data in an easily understandable format
- Balancing advanced functionality with user-friendly interface design
- Designing for users with varying levels of financial expertise
- Ensuring responsive design for multiple device types
Result:
The final product was a comprehensive digital platform that successfully met GainsGurus' objectives:
- Interactive tools allowing investors to explore data and build personal models
- Custom data visualizations enhancing analysis efficiency
- Premium content available on a subscription basis, creating an additional revenue stream
- An intuitive interface accessible to users with different levels of expertise
This project not only satisfied the client's needs but also strengthened our company's reputation in the financial technology sector. It demonstrated our ability to handle complex data visualization challenges and create user-friendly interfaces for specialized markets.
Personally, it enhanced my skills in financial data presentation and reinforced the importance of close collaboration between design and development teams in creating successful digital products.
Tools
- Figma
- Illustrator
- Photoshop
- Zeroheight
- Recraft